Daily Leverage Certificates
DLC Hotline: (65) 6226 2828
Market Commentary (Hong Kong)
For the week ending 24 May 2024
Multiple markets including gold, Hong Kong and China stock indices and the Dow closed this week with bearish engulfing candles. Market observers note that FOMC minutes from the early-May meeting appear to contradict Powell’s dovish press conference. Probabilities on the CME Fedwatch Tool swing from no hikes to another 25 basis points hike this year.
● China imposed sanctions on twelve US defense contractors including Boeing, Raytheon Systems and others. Their assets in China were frozen and key executives face travel bans.
● The UK's public health service knowingly exposed tens of thousands of patients to contaminated blood and blood products but hid the truth for decades.
● Yellen called on the EU to restrict Beijing’s technologies.
● Yield of 10-year JGBs rose above 1% for the first time since 2013.
● Nvidia is now embroiled in an AI chip price war with Huawei in China according to a Reuters report. Nvidia also shattered Wall Street forecasts with 600% profit growth y-o-y for its Q1 earnings.
Hang Seng Index closed this week at 18609, down 945 points or 4.83%. The closing candlestick pattern on the weekly chart is a bearish engulfing pattern which is associated with swing highs and further retracements. According to the horizontal histogram on the left which indicates turnover distribution, this week’s top coincides with a peak in turnover distribution around the middle of 19000-20000 level. This means that there was a high level of changing hands in the past which indicates that there could be a potential resistance or support around this level. HSI’s moving averages are still rising. This is a setup associated with further gains.
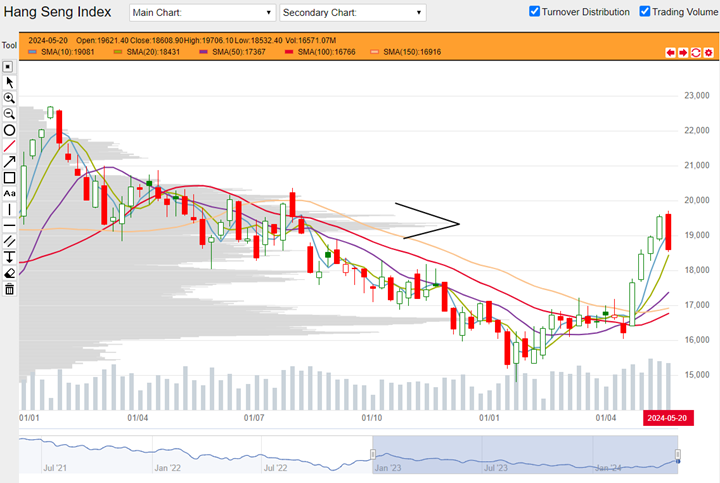
HSI weekly chart from 02 January 2023 to 24 May 2024 (Source: DLC.socgen.com)
Hang Seng Tech closed the week at 3799, down 313 points or 7.61%. The index closed the week as a bearish engulfing so this could indicate a swing high is in place. Moving averages are still rising which is a setup associated with further gains. Compared with the previous swing high in March this year and previous swing low in April, the index is currently printing a higher high which agrees with the indication given by moving averages.
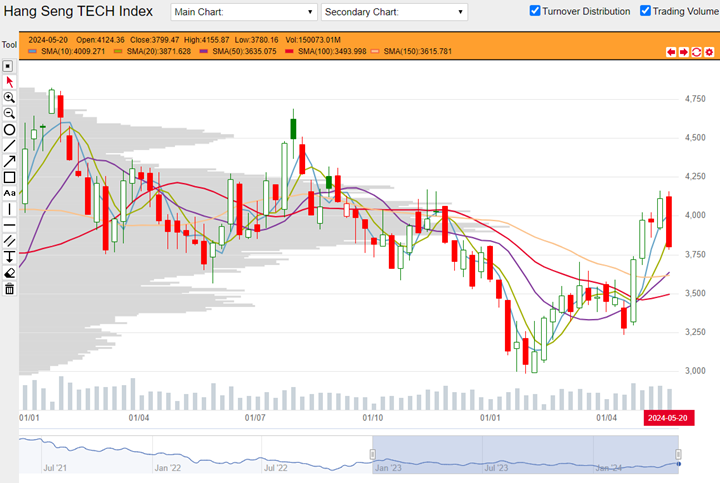
HSTech weekly chart from 02 January 2023 to 24 May 2024 (Source: DLC.socgen.com)
The Dow printed a new all-time-high on Monday but ended the week as a bearish engulfing pattern. Its chart pattern might or might not be a double top pattern but what’s notable is that its 50-Day SMA is now nearly flat. In addition the Russell 2000 index for small caps actually made a lower high over the same duration. This combination could spell bearish divergence. The Nasdaq 100 made another new high carried by Nvidia’s Q1 earnings.
The next FOMC meeting is scheduled on 12 June 2024.
Fed funds futures on rate hike probability by next Fed meeting as at this week’s close:
● 99.1% probability of no change |0.9% probability of 25 basis points hike
Fed funds futures on rate hike probability by next Fed meeting at last week’s close:
● 91.1% probability of no change |8.9% probability of 25 basis points cut
Probabilities on the CME Fedwatch Tool shifted to positive odds for another 25 basis points hike between now till March 2025. Probabilities indicate no cut in the coming June meeting but up till 100 basis points cut between July - December this year.
Both Shanghai and Shenzhen printed deep bearish engulfing patterns. Shanghai retraced to nearly its 50-Day SMA while Shenzhen fell below this average. Setup of short term 10, 20 and 50-Day SMAs for both indicators are still associated with further gains. Shanghai had made a higher swing high indicating an ascending trend although Shenzhen is flat over the same duration.
Other news:
● AIA, Kuaishou and Tencent bought back shares.
● China Construction Bank and Lenovo printed new 52-week highs.
Technical observations
Sands China 1928.hk bearish engulfing candle could be top of lower high.
Note chart features:
1. Sands China exhibits multiple elements that are associated with a bearish setup. Firstly, there is a descending trendline starting from the top of July 2023 connecting multiple swing highs on its way down. This week’s high was nudged against this high which suggests that stock price could be complying with this trend. Secondly this week’s action could lead to the establishment of a swing top at current levels. If this is true and if compared against swing high in early-April this year and previous swing low in early-March, then the current top is a lower high and suggests a descending pattern. Finally, apart from a golden cross between the 10 and 20-Day SMA two weeks ago, moving averages are arrayed in a descending sequence. These multiple elements are associated with further losses.
2. There are two levels to note. $20.90 is the lowest end-of-week close between last December and this April. This could be a potential support or resistance level. $19.60 is the end-of-week close for the swing low last November. Both price levels mark previous turning points. Both levels were beaten this week by this bearish candle.
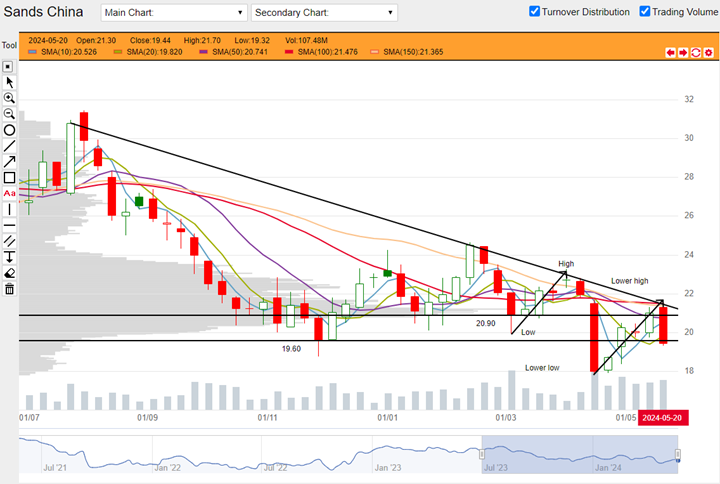
Sands China 1928.hk weekly chart from 03 July 2023 to 24 May 2024. (Source: DLC.socgen.com)
Underlying Index/Stock |
Underlying Chg (%)1 |
Long DLC (Bid Change%2) |
Short DLC (Bid Change%2) |
|---|---|---|---|
| Hang Seng Index (HSI) | +1.35% | CVMW (+5.14%) | EUCW (-7.74%) |
| Hang Seng TECH Index (HSTECH) | +2.46% | YPCW (+13.64%) | Y9GW (-6.06%) |
| Sands China (1928.HK) | +0.52% | WL5W (+1.72%) | QQOW (-2.33%) |
Brought to you by SG DLC Team
This advertisement has not been reviewed by the Monetary Authority of Singapore. This advertisement is distributed by Société Générale, Singapore Branch. This advertisement does not form part of any offer or invitation to buy or sell any daily leverage certificates (the “DLCs”), and nothing herein should be considered as financial advice or recommendation. The price may rise and fall in value rapidly and holders may lose all of their investment. Any past performance is not indicative of future performance. Investments in DLCs carry significant risks, please see dlc.socgen.com for further information and relevant risks. The DLCs are for specified investment products (SIP) qualified investors only.
Full Disclaimer - here